Table of contents
The association NVM has announced the housing market figures for the months of October, November, and December 2020.
Below we explain in normal, understandable language what these figures exactly mean.
This article was written in January 2021.

Table of Contents:
- House prices have risen
- Homes are being sold faster
- More homes have been sold
- There are currently fewer homes for sale
1. House prices have risen
Not the asking price, but the actual selling price
First, let's clarify something. House prices refer to the actual selling price of a home. This is different from the asking price you see on Funda for a home. A buyer can always have paid more or less than the asking price.
On average, the selling price was 2.5% higher than the asking price.
Increase of 11.6% to an average of 365,000 euros
According to the NVM, house prices have risen 'unprecedentedly fast' last quarter. The average selling price was 11.6% higher than in the same months in 2019. The average selling price in the months of October, November, and December 2020 was 365,000 euros.
The increase is calculated compared to the end of 2019
So for clarity, it is not that house prices are 11.6% higher than 3 months ago. The NVM compares the past 3 months with the same months (Oct, Nov, and Dec) in 2019.
Price increase varies by type of housing
The NVM distinguishes between different types of housing for the price increases. This is because the market for apartments develops differently than the market for detached homes.
The average selling price of apartments rose the least by 9.7%. The average selling price of a detached house rose the most by 14.1%.
So it seems that people suddenly much prefer a detached home over an apartment. This is also reflected in the speed at which homes were sold in the months of October, November, and December 2020.
2. Homes are being sold faster
On average, it takes 29 days to sell a house. That's 7 days less than last year when it was 36 days.
86% of all homes put up for sale are sold within 90 days.
Detached homes are on sale much shorter than last year, apartments longer
A detached house was on sale for an average of 73 days in 2019. At the end of 2020, that is only 46 days. So, detached homes are on sale for a month less.
Selling an apartment, on the other hand, took a day longer recently than at the end of 2019.
3. More homes have been sold
41,184 homes were sold in the last quarter of 2020 (Oct, Nov, and Dec) according to the NVM. The number of homes sold remained relatively the same compared to the third quarter. The number of homes sold is 2.3% more than the months of October, November, and December in 2019.
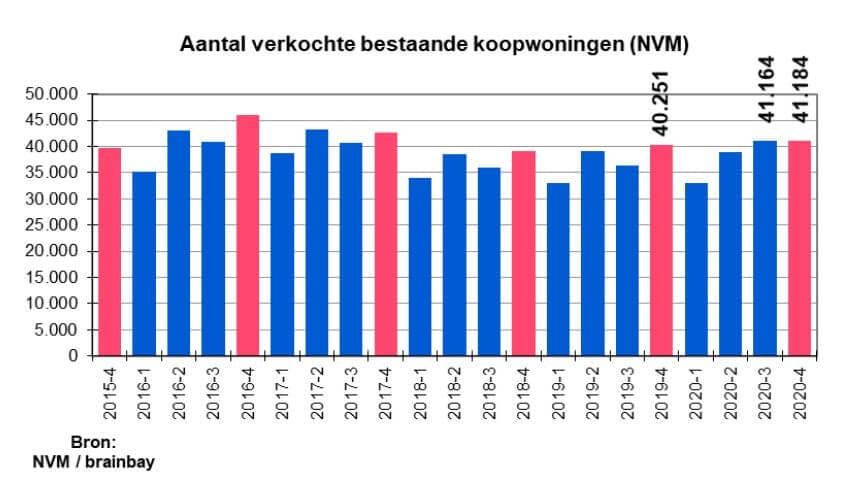
10% more apartments sold
There were 11,000 apartments sold at the end of 2020. That's 10% more apartments than in the same months in 2019. The number of sales in other types of houses hasn't changed much in terms of numbers.
Local differences in the number of homes sold
There are very clear differences between different regions. Below you can see where more and where less has been sold.
4. There are fewer homes for sale at the moment
If you are considering putting your home up for sale, it helps to know how many competing houses are being put up for sale by other owners. The NVM released the following about this. In the Netherlands, the number of homes for sale has been 33% less over the past 3 months than the year before.
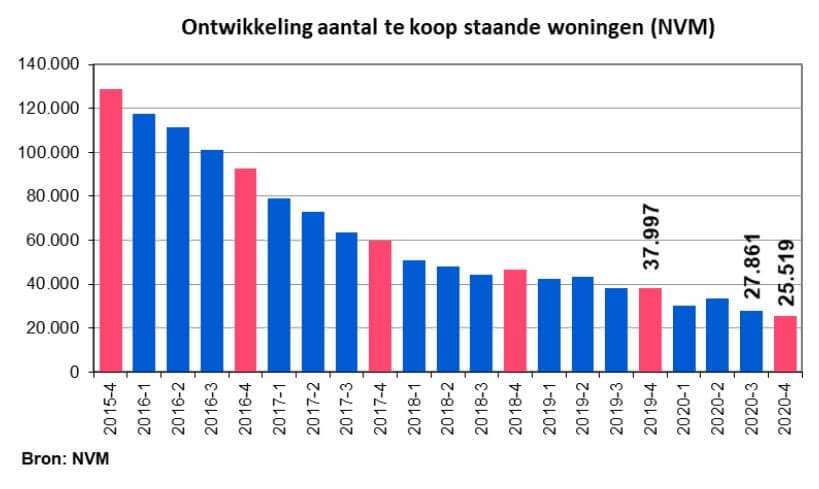
So, there were fewer homes for sale in October, November, and December than in the same months in 2019. It becomes even more interesting if we do not look at the Netherlands as a whole, but at the different areas.
Here are the most notable areas:
The number of homes for sale is determined by:
- how many new homes are put up for sale, and
- how many homes leave the market because they are sold, for example.
The NVM figures show that over the past 3 months, just over 4.5% fewer homes have been put up for sale.
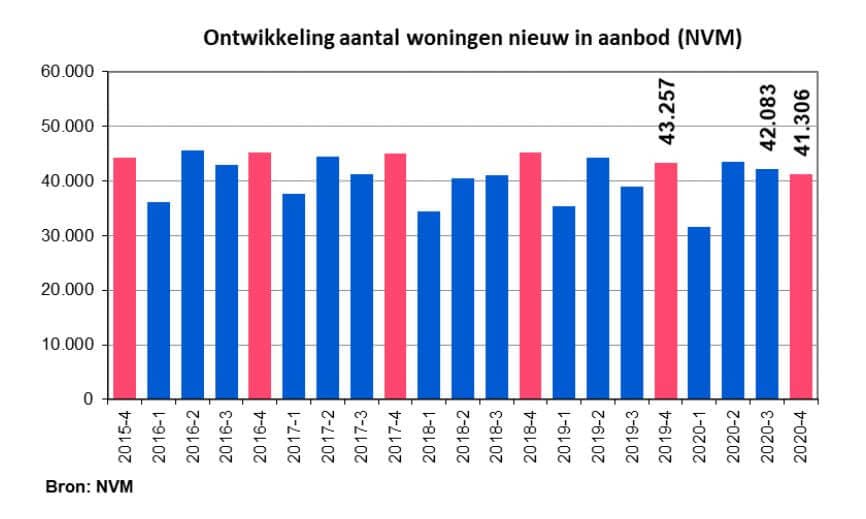
Source: NVM
What does this mean for potential sales plans?
It seems that people are adjusting their living plans to the consequences of Corona:
- Moving out of the city
- Living bigger
What is clear is that the scarcity of homes is still there. Fewer houses are put up for sale, they are bought faster and for more money.
If you now want to live smaller, you're in good shape. You can easily get rid of your detached home and the competition to get an apartment is manageable.
The other way around will be difficult. Not so much with the sale, but especially with finding a home.
Source: https://www.nvm.nl/wonen/marktinformatie/
Free valuation of your house
Enter your postcode and house number below and get an estimate of the value from multiple real estate agents by email.
Handy if you are considering selling your home.
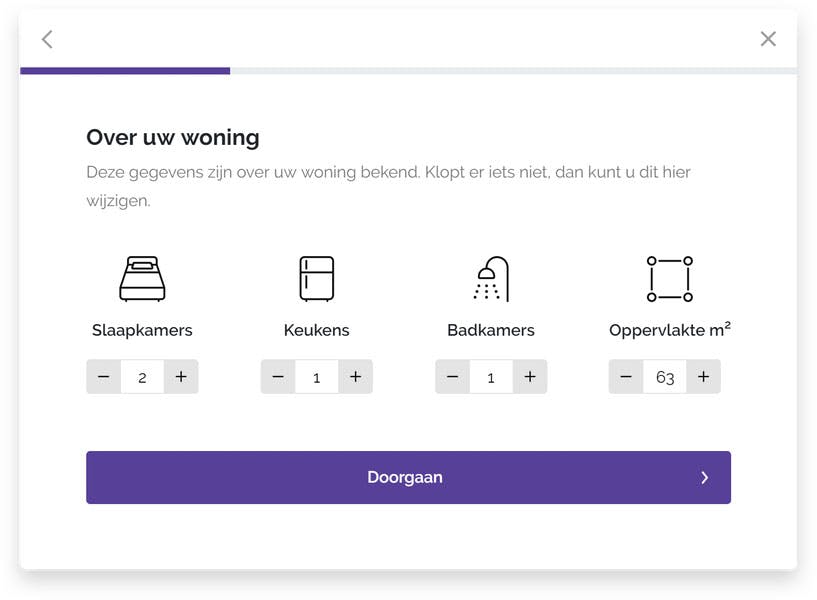
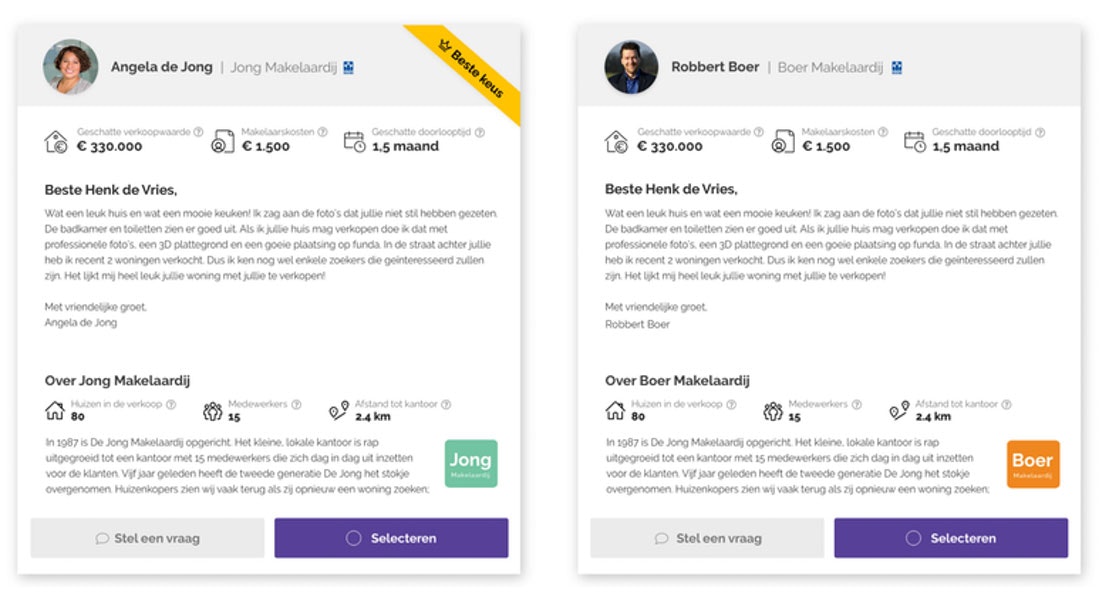
Gratis waardebepaling van jouw huis
Om een goed beeld te krijgen van de verkoopkansen van je woning, hebben we een tool gemaakt waarbij je in één keer bij alle makelaars in de buurt aangeeft dat je mogelijk wilt verkopen.
Ontvang meerdere reacties van makelaars uit de buurt. Ontdek welke vraagprijs zij aanbevelen voor uw woning en welke kosten zij rekenen. Vergelijk alles in één handig overzicht, zodat u met gemak de beste keuze maakt.
Vul hieronder je postcode en huisnummer in en ontvang gratis een waardebepaling door makelaars uit de buurt.
